![]()
Investor Newsletters
12 April 2021
/
Dear Fellow Investor
OLYMPIAD UNIT TRUSTS: THE FUTURE
Some of you have questioned me regarding the continuation of the management of the
Olympiad funds should I not be able to work. Well, I have news for you. Mr Robert Walton of Boutique Collective Investments (BCI) and myself
will co-manage the Olympiad funds with immediate effect. He has 28 years’ experience and hold the following qualifications; B.Acc (Hons),
CMA and CA (SA) . BCI with about R200billion assets under administration is the Management Co of the Olympiad funds.
As you know most of my personal, local money is invested in the Olympiad unit trusts. Although these funds performed relatively well and stable over the last 38 months (since 25/1/2018) the returns over the last twelve months have been disappointing. An opportunity was missed to invest about 30% of the Olympiad Funds in the JSE when fear was rampant, following a crash of 33.28% in March 2020. From 25/01/2018 to 8/4/2021 the JSE Alsi increased by 8.71% from 61,684 to 67,054.
The global impact of massive, ongoing stimulation by US authorities plus low US interest rates till 2023 viewed against expensive stock markets mean that we need to increase our equity exposures with caution. As a result, it was decided to rebalance the Olympiad funds, still keeping more than 50% in fixed income, as follows:
|
OLYMPIAD |
|
|
Fixed |
57.87% |
|
Equity |
20% 18.93% |
|
Property |
3.20% |
|
|
|
|
OLYMPIAD |
|
|
Fixed |
52.96% |
|
Equity |
23.92% 20% |
|
Property |
3.12% |
Note: In a crisis the Rand seems to depreciate against the US Dollar for example
March last year. This depreciation should cushion future potential losses in
foreign equities. The goal of positive returns over 12-16 months to be
retained.
Please feel free to contact me should you have any questions related to the Olympiad
funds.
15 March 2021
/
Dear Fellow Investor
STATE OF THE MARKETS
Against the backdrop of record high US stock and residential property markets the Fed’s stated short-term goal is to create another ± 9.5 million jobs to achieve maximum employment(Fed’s one goal). These are jobs lost since pre-covid. Their other goal i.e. inflation is currently running under the target of 2%pa so of lesser importance. Note most other global central banks follow the Fed.
The markets, looking ahead after massive monetary/fiscal stimulation with more to come, expect maximum employment and a rise in inflation sooner rather than later hence the recent selling of US Government Bonds with the yield on the 10-year increasing from 0.5% to 1.55%. As a result US Government Bond holders suffered a capital loss of 12% year to date. Who want a bond paying 0.5%pa if he can invest in one paying 1.55% pa? This also caused the stock markets to stumble.
It is however anticipated that the Fed will continue to force interest rates down by buying bonds/mortgage securities (currently at $120billion pm) to keep interest rates low and stimulate the US economy. This will probably come at the cost of significantly higher inflation/interest rates over a longer period of time. Higher inflation/interest rates plus expected increase in US corporate tax rates over the next two years (to service record amount of US Government debt) will likely force a serious re-rating of the US stock, bond and property markets downwards. These markets are at or near record highs for example the “Buffett Indicator” (Wilshire 5000 index, representing the total US stock market, divided by the US GDP) is at a record 200%+, even higher than the 159.2% recorded before the dot.com bubble about 20 years ago. So this is no time to let our guard down unless we want to lick our wounds for many years to come. However due to very low short term interest rates locally/globally and the expected support of the Fed for stock/bond markets over the short/med term, the Olympiad Funds have been rebalanced as follows:
| Local Short Term Income Funds (Cash/Bonds) | 90% |
| Local Financial Shares | 4% |
| Local Property Shares | 3% |
| USD Money Market | 3% |
The abovementioned shares are relatively cheap in comparison to the JSE and pay dividends of 6%+. In other words they represent a greater margin of safety against losses. The JSE is trading at a very high PE ratio (Price to Earnings ratio over last 12mths) of 24,8 mainly due to a run on resources/mining shares over the last couple of years. The USD is cheap against the Rand.
Please feel free to contact me should you have any questions regarding the Olympiad funds.
Kind Regards
4 December 2020
/
Click here to download newsletter
August 2020 Newsletter
Dear Fellow Investors
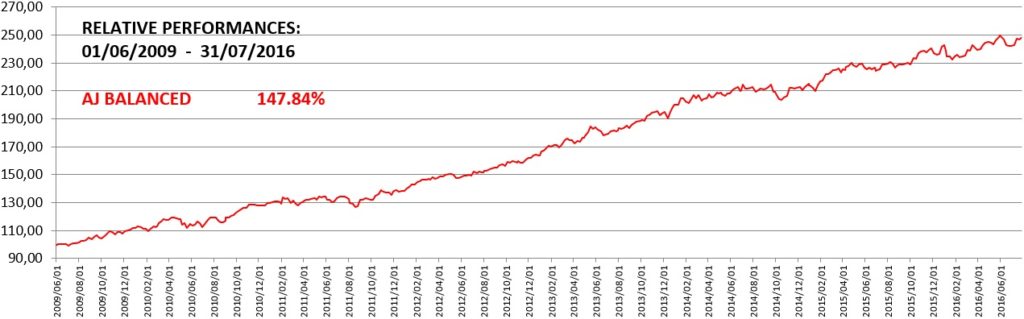
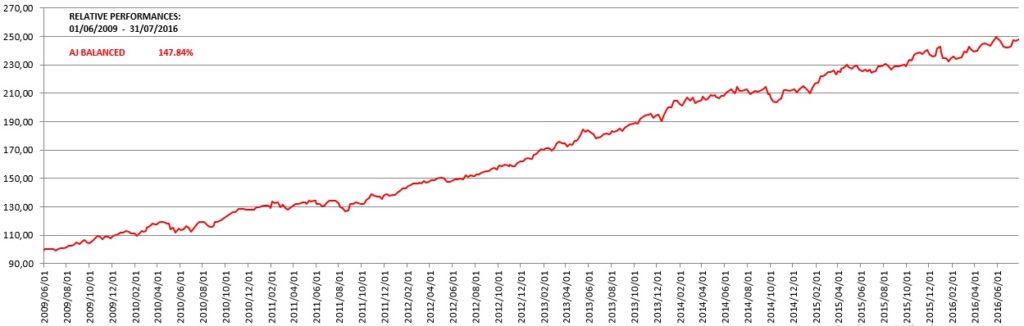
If you truly believe, like Buffett, in being fearful when others are greedy and greedy when others are fearful as well as the triumph of optimism (businesses) over the medium/long term then you should keep your local funds in the Olympiad unit trusts.
The investment strategy of the Olympiad funds has proven itself in bad and good times. Bad times like the Great Recession of 2008/09 and locally from 25/01/2018 till now, including the stock market crash earlier this year. Good times from March 2009 to 2018. During bad times the emphasis is on protecting capital like earlier this year when two comparable managed unit trusts (which I am not allowed to name as I am no longer representing AJ) dropped by 26.43% and 22.67% whilst the Olympiad funds only dropped by 1.61% and 2.06%. During good times e.g. from 1/6/2009 to 31/8/2019 the old AJ Wrap Fund, which turned into the Olympiad BCI Managed FOF, yielded 170.12%, in comparison to its peers in the SA High Equity Managed category yielding 140.22%, even with a minimum of about 30% in cash at all times. The urban inflation rate over this period was 67.31%. Regulation 28 managed unit trusts e.g. Olympiad BCI Managed FOF are now allowed to invest 30% of their holdings in foreign assets including equities.
Following the latest changes in the Olympiad funds, which I referred to in my previous letter to you, the returns of the Olympiad funds are as per graph attached. Note the smooth increase in the Olympiad funds in comparison to minus 5% to plus 5% swings in the JSE. In fairness the money market rate should be doubled to 0.58% as interest earned in November is credited in the first week of December.
Constant economic changes necessitates regular adaptations. These changes are best done within managed unit trusts (like Olympiad) as they, unlike changes in Wrap Funds, do not result in a CGT liability for you.
May you and your loved ones enjoy Christmas and have a Blessed New Year. Let us all hope and pray for a better 2021.

14 October 2020
/
Click here to download newsletter
August 2020 Newsletter
Dear Fellow Investor
The creation of wealth implies sustainable increases in wealth with limited losses at any time. This is our
primary goal at Olympiad i.e. positive returns over rolling 12 – 18 month periods.
A fair question is whether stock market listed businesses have created sustainable wealth for shareholders over the last number of years. Reviewing the following indices, except for the Dow and S+P500, the answer is an emphatic no:
| JSE |
No sustainable increase since 20/4/2015 |
| Dow Jones |
+7.4% from 22/1/ 2018 with drop of 30% + in March 2020. |
| S+P500 |
New record high however it is 41% to 18% more expensive than its average over the last 20 years, depending on whether you use price to earnings ratio over the last year or over the last 10 yrs as basis of measurement. |
| UK Ftse 100 |
No sustainable increase since 1/1/1999. |
| Europe Euro Stoxx 50 |
No sustainable increase since May 1998. |
| China Shanghai Composite |
No sustainable increase since March 2007. |
(Sources: Trading Economics.com and Shiller PE Ratio gurufocus.com)
With businesses i.e. employment struggling it is unlikely that increases in global property values are sustainable.
Unlike previous economic recessions interest rates and bond yields are already very low as you can see from the following list of 10 yr Government Bonds:
| USA |
+0.78% pa |
| UK |
+0.28% pa |
| Germany |
-0.54% pa |
| China |
+3.22% pa |
| RSA |
+9.49% pa |
(Source Trading Economics.com)
After suffering losses from our property and gold holdings over the last three months, the exposure to our short term local income funds i.e. PSG Income and Absa Core Income was recently increased to 50% each. These funds yielded 9.43% and 8.02% over the last year till the end of last month. (Source Morningstar).
questions/comment.
14 August 2020
/
Click here to download newsletter
August 2020 Newsletter
Dear Fellow Investor
STAYING AHEAD WITH BUFFETT AND CO
Although Olympiad focusses on four asset classes (property, bonds, cash, and equities) not sub-classes/sectors like mining, retail, financial, etc. we decided to invest 5% of the Olympiad Funds in gold shares (Old Mutual Gold) with 23.8% exposure to foreign gold mines. This should act as an insurance policy against a serious economic downturn like the US experienced from 1964 to 1980. During this 17 year period the Dow was flat whilst the price of gold increased from $43.48 (1971) to $589.75 (1980). The main causes were the US inflation rate increasing from 1% pa (1964) to 14% pa (1980) coupled with interest rates moving from 3.5% pa (1/1964) to 20% pa (1980). This in turn resulted in low economic growth and high unemployment with investors turning to gold as a safe haven.
According to Investopedia “Nixon (US President late 60’s/early 70’s) wanted cheap money: low interest rates that would promote growth in the short-term and make the economy seem strong as voters were casting ballots.” Is this not what is happening in the US today? No wonder Warren Buffett increased Berkshire Hathaway’s cash holding to a record $146.6 billion, at the end of June, by selling more shares than he bought during this quarter.
Last but not least a word about ‘creative destruction’ often used by economists. An example of this would be to demolish an old building and rebuilt a new, modern building in its place. On a larger scale capitalism needs creative destruction to generate growth based on competition. In other words unsuccessful companies should be allowed to perish. If authorities like the US Government/Central Bank keep unsuccessful companies afloat, like they did since March, then they are wasting society’s resources (manpower, capital, natural resources, etc.) which in turn will result in a poorer society.
As the fear of Hell keeps Christians straight so the fear of bankruptcy should keep companies straight i.e. prudent and careful in trying to control the risk they take. If not then capitalism and freedom will lose its edge.
Please feel free to contact me should you have any comments/questions
6 August 2020
/
Click here to download newsletter
August 2020 Newsletter
Dear Fellow Investor
STAYING AHEAD OF THE CURVE
True to our stated conviction to be greedy when others are fearful, to invest in cheap markets when others see a bleak future, relatively small portions of 8% (Olympiad BCI Managed FOF) and 12% (Olympiad BCI Worldwide Flex FOF) were invested in local listed property with about 28% exposure to European property.
The chart hereunder shows you the return of our four asset classes and inflation rate from 24/6/2002 to 28/7/2020 totalling:
| SA Listed Property TR | +963.64% |
| JSE All Share TR | +797.95% |
| JSE All Bond TR | +408.05% |
| AF Money Market | +296.89% |
| Inflation (CPI-Urban) | +153.08% |

The crash in listed property after Jan 2018 followed by a relatively small recovery since March 2020 afforded us a great opportunity to invest in this asset class but still maintain our goals of positive returns over rolling 12-18 months. Until the end of 2017, including era of very poor national governance since 2009, listed property outperformed the stock market by 2.5 times. Note – return from listed property consists of yield (net rental) and capital gains. Listed property prices usually start to recover about a year before an actual improvement in local and global economies. This recovery will probably be based on a vaccine for Covid19 or effective therapeutic treatments.
The rest of the Olympiad funds are in low risk, interest bearing income funds (local bonds and cash) i.e. Absa Core Income and PSG Income in equal proportions. Stanlib Income has been replaced by PSG Income due to relative underperformance of Stanlib Income since the crash on 24/3/2020(+1.92%) in comparison to PSG Income(+5.78%) with one year return figures till end of July 6.83% and 9.39% respectively. This could be due to size and change in management.
The property investment is in 1nvest (Stanlib) SA Property ETF. As an exchange traded fund the management fee is only 0.29% pa in comparison to an average of about 1.50% pa. for property funds. This ETF since its inception on 18/2/2013 has tracked the JSE Listed Property performance graph almost exactly. It consists of 20 listed property companies covering all types of property holdings which is adjusted every quarter.
Listed property only represents about 5% of the JSE so it is not possible for large managed unit trusts to have significant holdings in this asset class.
As with future share investments this property investment will result in more short term volatility but the potential for significantly higher returns like over the last 18 years. From June 2002, following stock market crashes in 1998 and 2002 in excess of 30% every time and with local interest rates at 12.5%, listed property and shares(JSE) still significantly outperformed bonds and cash as you will see from the above growth chart.
Thank you for your trust in very challenging times. Please feel free to contact me should you have any questions or comments.
July 2020
/
Click here to download newsletter
July 2020 Newsletter
Dear Fellow Investor
BACK TO BASICS
Like Warren Buffett we dare not invest in expensive equities/stock markets.
Question:
Why not?
Answer:
As there is a high probability of losing a significant portion of our investment over many years to come. For example the Nasdaq composite index took from March 2000 to May 2015 and the S+P500 from March 2000 to Feb 2013 to break even and embark on a sustained uptrend. From March 2000 to March 2009 these two markets suffered two crashes of 45%+. (Source: Yahoo Finance.)
Question:
How expensive is the S+P500 today (23/06/2020)?
Answer:
The price-to-earnings (PE) ratio is the most common method to determine the expensiveness of a stock market. This ratio is the price you pay today for a share in e.g. S+P500 companies relative to the earnings of these companies over the last 12 months. Currently this ratio is 26.9 which is 67% higher than the historical average of 16.1. (Source: Shiller PE ratio/guru focus.) This means it will take 26.9 yrs to earn back every dollar you invest in the S+P500 should earnings remain the same as over the last 12 months. Should earnings decline then PE ratios will increase as explained hereunder.
The very high PE ratios of some shares e.g. Amazon (145), Netflix (106), Tencent (51) reminds me of 1999 pre-crash.
Question:
How does the current S+P500 PE ratio compare to ratios before or during prior stock market crashes?
Answer:
Dotcom Crash (1999-2002). PE ratio increased from 33.4 (March 1999) to 46.7 (March 2002) whilst the S+P500 crashed by 47.6% from 20/03/2000 to 30/09/2002.
Great Recession (2007 – 09). The PE ratio increased from 22.4 (1 Dec 2007) to 26.5 (1 September 2008) and then to 123.30 (1 June 2009) – highest in history. The S+P500 crashed by 56.13% from 1/10/2007 to 2/3/2009. (Sources: Yahoo Finance, Shiller PE ratio/guru focus.)
Question:
Why do PE ratios increase during a recession?
Answer:
Earnings drop faster than share prices during a recession. Daily share price movements give you a false
impression that share prices lead and earnings follow. Reality is the opposite. Note earnings are reported quarterly in arrears while stock markets try to look 12 months into the future.
Question:
The S+P500, Nasdaq and the JSE is going higher and higher, from their lows in March, should we not go along for the ride and get out before the next crash?
Answer:
No margin of safety. This will put us on a far more risky path as no person can tell you when exactly the next crash will occur nor how fast or deep it will be. For example on 19/10/1987 the Dow dropped by 22.61% and on 16/3/2020 by 12.93%.
Another dangerous sign is the rampant speculation/ trading on US markets since March. I have seen and experienced this type of speculation in 1999. It ended in tears as I wrote in the February newsletter which is available on our website. The success rates of individual and day traders are very low. Brazilian study showed only 3% of day traders actually make a profit and less than 1% more than the Brazilian minimum wage. University of California/Charles Schwab found that individual traders substantially underperformed the market over a six year period. Short term rich, long term poor.
Please contact me should you have any questions/comments.
June 2020
/
Click here to download newsletter
June 2020 Newsletter
Dear Fellow Investor
Economic Recession/Expensive Stock Markets?
Please see relative performance graph hereunder:

Question: Where would you have preferred your local money to be invested since Jan 2018?
(Olympiad BCI Managed FOF – 5/161 unit trusts in SA Managed High Equity category at lowest risk over 3 years till 31/3/2020, 5/179 over two years and 5/193 over 1 year. Source: Morningstar).
Is this global stock market rally sustainable or should we expect a serious correction/crash of ±50%? The speed of this relief rally caught myself and many seasoned investors including Buffett by surprise. The rally is built on the US Central Bank (Fed) printing new money to the tune of $3 trillion following an announcement in early April. The Fed’s total balance sheet (new money) increased to $7 trillion by the end of last month and is expected to increase to $9 trillion from less than $1 trillion in 2008 pre last crash.
Some of the $9 trillion will be used to purchase corporate junk bonds which it has never done before. This of course will keep corporations afloat which should have gone bankrupt in a normal, capitalist economy based on competition and private ownership of money. The question is whether the Fed will be able to prop up all these junk bonds of which 540 issuers show a high probability of default. So the bond and stock markets are artificially supported by the Fed. The minute this support stop these markets will in all likelihood collapse.
The US Government Debt increased from $22 trillion a year ago to $25,7 trillion in May 2020. This debt plus corporate debt of $9,6 trillion and the Fed’s $7 trillion result in a total of $42,3 trillion. This is almost double the $21.2 trillion worth of goods and services produced by the USA in 2019 i.e. GDP.
With the current unemployment rate of 13.3% (3.5% in Jan 2020) plus record high levels of debt and negative economic growth forecasts for 2020, I believe the current stock market values are not sustainable. Based on Prof Robert Shiller’s CAPE Ratio, price/earnings ratio of the S&P500 companies with earnings adjusted for inflation over the last 10yrs, as an investor in the S&P500 over the next 10yrs you should expect to lose 1.6%pa. This ratio is currently 79.4% higher (more expensive) than its historical mean and has proven quite accurate in the past.
Please feel free to contact me should you have any comments or questions.
May 2020
/
Click here to download newsletter
May 2020 Newsletter
Dear Fellow Investor
WHERE ARE WE NOW?
We are in local cash and shorter dated bonds. As a result we did not partake in recent stock market crashes and returned to positive +0.56%, excluding money market interest, in April. Please note that interest earned on 33% of our money, in BCI money market, will be credited after the end of every month. As money market rates drop, bonds offering higher rates become more attractive resulting in the capital appreciation of bonds. This should of course increase our investment returns.
STOCK MARKETS
As at 27 April 2020 the JSE ALSI and S+P 500 (top 500 US companies) indices were back to the levels they recorded in May 2014 and 22 Jan 2018 respectively.
THE FUTURE
It is highly unlikely that we have seen the bottom of the US and by extension global stock markets including JSE. The S+P 500 is about 57% more expensive than its long term average. At the end of the Great Recession (March 2009) it was more than 10% below its long term average i.e. cheap. At the time it offered us a significant margin of safety. Not so now.
Stock markets went from “fear mode” in March to the recent “relief rally” and are now in “frustration phase” where they do not know which way to go. Relief rallies, recovering about 50% of losses, are common. For example during the Great Recession from 8 Sept 2008, there were six such rallies averaging 13% per rally, only to hit a bottom in March 2009. Most of the rallies in 2008 like now were based on Monetary (Government) and Fiscal (Fed) stimulus optimism.
The reality that is unfolding however is that:
- More than 30 million US workers lost their jobs over the last 6 weeks. All the jobs created since the Great Recession wiped out. Imagine the shock of workers/consumers to go from 3.6% unemployment rate, lowest in 50 years, to a very high rate. It is expected that the US unemployment rate will increase to about 20% over the next couple of months. In the Great Depression and Great Recession this rate topped 24.9% and 10% respectively.
- Due to increasing unemployment numbers the consumer share of the US economy at about 70% is diminishing fast. Expect less spending and more savings from US households with jobs.
- It is further expected that it will take US corporations 12 – 18 months to increase their revenues/gross income back to where they were before the crisis.
- Dr Anthony Fauci, Director, US National Institute of Allergy and Infectious Diseases stated that he is “almost certain” that a second wave of Coronavirus will hit the US later this year. If so, it will be a repeat of what happened in 1918 when the outbreak in Jan 1918 was followed by a second wave in Oct 1918. (Spanish Flu.)
To summarise, although the JSE is cheap the S+P 500 is not. We know from history that when the US stock markets crash the impact is felt globally so we need to be conservative for now. I think Wall Street (S+P 500) needs to catch up with Main Street (realism).
Please feel free to contact me should you have any questions/comments.
April 2020
/
Click here to download newsletter
April 2020 Newsletter
Dear Investor
OLYMPIAD UNIT TRUST PORTFOLIOS OVERVIEW – APRIL 2020
During April 2020 global and local markets continue to perform well, although a significant portion has been offset by the strengthening Rand. We increased our local and global equity exposure in both the Olympiad BCI Managed Fund of Funds as well as the Olympiad BCI Worldwide Flexible Fund of Funds during April. Currently the asset allocation is as follows:
|
Olympiad BCI |
Managed FoF |
Worldwide FoF |
|
SA Equity |
20% |
20% |
|
Offshore Equity |
15% |
25% |
|
Property |
4% |
4% |
|
Fixed Interest |
61% |
51% |
As a result, the portfolio performance has picked up from previous months (source
MoneyMate 30 April 2020).
|
Olympiad BCI |
Managed FoF |
Worldwide FoF |
|
1 month |
0.64% |
0.37% |
|
3 months |
0.68% |
0.40% |
|
6 months |
1.75% |
1.46% |
|
1 year |
2.60% |
1.43% |
We are aware of the relative low returns that the portfolios generated during the past year. We will continue to actively manage the portfolios until their amalgamation with the BCI Best Blend funds, which has performed very well during the past year (BCI Best Blend Balanced Fund – 25.3% and BCI Best Blend Worldwide Flexible Fund – 17.3%, source MoneyMate 30 April 2020). Anton van Niekerk will not be involved in managing the BCI Best Blend Funds.
The amalgamation ballot letters will be circulated by the end of next week with the effective date being 6 August 2021. Please return your votes by 2 July
2021 to the auditors, email address is in the letter.
Regarding
our investment outlook for the remainder of the year:
- Earnings growth estimates and earnings revisions
globally are now at, or very close to their historical peaks. - Despite this, equity valuations remain overly extended
across the globe. - Any disruption in the current vaccine roll-out program
or the emergence of a global third wave of the prevailing public health
crisis, with renewed lockdowns, could cause a hugely adverse correction. - USD$ fundamentals are aligning for a possibly stronger
dollar over the short to medium term, and this could pose a notable
headwind towards cyclical growth assets, especially if sustained beyond
the medium term. - An inflation overshoot due to rising GDP growth
(excessive pent-up demand at individual and corporate levels) alongside
supply side constraints and low base effects can lift US Bond Yields
higher than expected and for longer than anticipated and consequently
cause an undesirable equity market correction. - It is possible, as a result of all of the above factors
that we could enter a macro-regime shift where the primary investor
concern shifts from “deflation” towards “inflation” at a time when nearly
all major US asset classes are priced for perfection i.e., priced fully
with material downside risk. - Geopolitical risk appears to be temporarily calm but
can flare up at any time. With the currently extended equity market
valuations the market impact of any flare up will likely be both adverse
and significant.
We will therefore keep a close eye on the markets and the
asset allocation of the portfolios, but it is important to retain a long-term
investment outlook.
Please
feel free to contact me should you have any questions related to the Olympiad
funds. My email address is rwalton@bcis.co.za.
THE COVID-19 DISEASE AND ITS IMPACT ON THE ECONOMY AND FINANCIAL MARKETS
The fear caused by the spreading and mortality rates of the Covid-19 disease wreaked havoc on financial markets – until governments and central banks intervened. That halted the free fall and contributed to some recovery in the prices of shares and bonds worldwide. Central banks reduced interest rates and made sure enough liquidity is available, while governments and private sector companies provided assistance packages to companies and households in distress. But for markets to recover further, “a fast decline in the spreading of the virus” is needed.
The key to the end of the crisis is in a vaccine. But, in its absence, the alternative is measures to reduce the rate at which the virus is spreading. In this respect, social distancing and lockdowns are implemented around the world. Its success will be determined by the growth rate of new cases – that is when new cases the next day is lower than the current day. A number lower than 1 (declining fast to 0) is what is needed for these approaches to be successful. The growth rates are increasing in some countries (e.g. USA) and declining in others. Although the rolling weekly average for the world is still more than 1, the good news, as the graph below shows, is that the daily world growth rate is declining – as “lower high” and “lower low” growth rates are registered. But, it is happening very slow – the next two weeks will be crucial for success. If successful, lockdowns in some countries may be replaced by strict social distancing measures. If not, lockdowns may continue for longer.
April 2020
/
Click here to download newsletter
April 2020 Newsletter

In South Africa, the weekly moving average growth rate declined from 1.32 on the day of the lockdown (26 March) to 1.05 on 4 April. The same numbers for the world are 1.13 – and also 1.05. At this early stage it seems as if South Africa’s measures are working – but as the growth rate is still more than 1, chances are slim for the lockdown to end on 16 April.
This indicator should also signal the outlook for the resumption of economic activity, as well as market movements. The faster the decline, the higher the hopes for a resumption of economic activities – and vice versa. Due to uncertainty, it is difficult to make economic forecasts. However, several institutions attempted this exercise. For instance, JP Morgan worked on the assumption that the pandemic ends by end June. If so, a two-quarter GDP contraction is expected in the USA (-10% in Q1 and -25% in Q2) and the Euro Area (-15% and -22%). Thereafter, economic growth is expected to increase by 6% over the final two quarters in the USA (assuming that social distancing policies are significantly relaxed by mid-year.) China’s Q1 growth may experience a huge decline of 41% but can register a V-shaped recovery, rebounding by 57% in the second quarter. China’s full-year GDP growth forecast is 1.1% (from an initial 5.9%). The world is expected to register growth of around 0.3% in 2020, increasing to 3% in 2021.
In South Africa, the best-case scenario is for the economy to shrink by 2% in 2020, but It can be 4-6% in worse cases. South Africa’s woes were aggravated by the inevitable decision of Moody’s on 25 March to downgrade the country to junk status with a negative outlook. And the economy will be confronted by huge job losses amid electricity shortages. Under these circumstances, the South African Reserve Bank will have little choice but to reduce the repo rate further. Markets, on the other hand, recover before economic indicators. If things work according to plan (growth factor declines fast), the partial recovery over the past two weeks may continue. For instance, at its lowest point the JSE ALSI was down 34.9% since the start of the year, but recovered to end the month 22.1% down. Similarly, the All Bond Index was 16.6% down, but improved to be 8.7% down by end March. However, continued volatility in the markets will persist – as international and domestic economic indicators emerge to indicate the magnitude of the virus’ impact. This, the growth rate of the spreading and other government measures will impact markets going forward.
JOHANN VAN TONDER
M.COM (ECONOMICS)
ECONOMIST
March 2020
/
Click here to download newsletter
March 2020 Newsletter
Dear Fellow Investor
STOCK MARKET CRASHES
The lesson from history is that stock market crashes occur much faster than recoveries. What we have experienced over the last month or two appear to be the start of a crash:
JSE (ALSI)
JSE (PROPERTY INDEX)
USA (FTSE USA TR USD)
EUROPE (Morningstar Europe GR EUR)
UK (FTSE 100 TR GBP)
CHINA (Morningstar CHINA GR CNY
(Source: Morningstar. Note: Performances in local currencies.)
-26.71% (18/1 to 15/3/2020)
-27.09% (18/1 to 15/3/2020)
-24.71% (19/2 to 15/3/2020)
-36.57% (19/2 to 15/3/2020)
-29.24% (20/2 to 15/3/2020)
-15.35% (13/1 to 15/3/2020)
At this stage of an economic cycle it is important to remember the following:
- Do not try to catch a falling knife.
- Bottom of a stock market must be determined by other investors not us. Must we rush to get back in? No.
“If this is the bottom of the market, there will be a 30 to 60 day period where equities can be purchased at these levels” – Don Brown, US Investment Manager. He has a better track record than Warren Buffett over 55 years since 1960 in underperforming the S&P 500 in only 2yrs whilst about 80% of equity fund managers cannot beat the market they invest in over most years. (Source: The gazelle of Wall Street, Fin 24, 18 Feb 2016.) - To recover losses from JSE crashes over last 44yrs, till end of 2019, took an average of 2.6yrs. The long term comparable figure for the S&P 500(USA) is 4.4yrs. Note however that it took the S&P 500 from 20/8/2000 to 16/9/2007 and from 16/9/2007 to 24/3/2013 to break even. JSE crashes are normally accompanied with devaluations of the Rand against the US Dollar due to Americans withdrawing their investments back home. Since 2000 significant recoveries followed these devaluations. For example the Rand recovered from R11.64(Dec 2001) to under R6 (Jan 2005) to the US Dollar.
In the meantime our Olympiad funds interrupted their steady increase every month with a drop of about 1% from 24/2/2020 to 15/3/2020 due to local bonds exposure. We are currently decreasing our local bond holdings in favour of cash and shorter dated bonds(less risky) resulting in an approximate 50/50 split. With US interest rates dropping to nil, local interest rates are expected to be reduced which in turn will be supportive of local bonds. Over the medium term the higher local interest rates should attract foreign funds and support the Rand. Cash we need because as Buffett said “cash combined with courage in a time of crisis is priceless”. Courage in getting back into stock markets like after 2009 which is a history that we shared.
Please feel free to contact me should you have any questions. Remember about 90% of my own local investable funds are invested with your funds in the Olympiad unit trusts.
February 2020
/
Click here to download newsletter
February 2020 Newsletter
December 2019
/
Click here to download newsletter
December 2019 Newsletter
October 2019
/
Click here to download newsletter
October 2019 Newsletter
July 2019
/
Click here to download newsletter
July 2019 Newsletter
May 2019
/
Click here to download newsletter
May 2019 Newsletter
In a landmark paper, published in 1986, Determinants of Portfolio Performance, Brinson, Hood and Beebower concluded that asset allocation is the primary determinant of a portfolio’s performance and accounts for some 90% of the return experienced. Ibboston and Kaplan later confirmed this in 2000 with a finding of 75%.

WORDS ON WEALTH
MARTIN HESSE | martin.hesse@inl.co.za
Saturday, January 12 2019 | AFFLUENCE
It wasn’t a good year for investors in equities
OH DEAR. Last year was not kind to investors. It was the worst year for the JSE since the Big Crash in 2008. And it started off so well, with all the optimism around our new president.
I won’t go into the reasons for the malaise, which differ according to the analyst you speak to. But let’s look more closely at the figures, which make for enlightening, although somewhat depressing, reading.
The FTSE/JSE All Share Index ended 2017 at 59 504 points
(after breaking the 60 000 mark in November 2017). It ended 2018 at 52 736 points, a drop of 11.4%. That’s low compared with the 27.5% drop in 2008, but here’s the rub: there hasn’t been a crash. Just lots of volatility, with most of it occurring in the last quarter.
Looking at the total return index (which measures share prices with
dividends reinvested), the drop was a slightly more palatable 8.5%. This is the better indicator when considering the performance of your equity unit trust or exchange traded fund investments, because, unless you’re drawing an income, you’re likely to be reinvesting your dividends.
So how did our equity fund managers do in the tough times that were 2018?
Not too well, sadly. The average South African general equity unit trust fund was down 8.9%, according to Profiledata. Of the 163 funds in this sub-category, only two did not end in the red after costs: the Kagiso Islamic Equity Fund (up 1.7%) and the RECM Equity Fund (up 0.47%). The worst-performing funds were down as much as 20%.
It’s likely that the better performing funds had a substantial
exposure to our resources sector, the only sector to have done well in 2018. The worse-performing funds were most likely heavily invested in industrials, which had a miserable year. The darling of these stocks, Naspers, which featured large in many an equity portfolio, lost 16.5% of its value in 2018.
High-equity multi-asset funds also did poorly. These funds can have a maximum of 75% in equities, but the managers can reduce their equity exposure if the markets are looking dicey, switching to safer options such as bonds and cash. Of the 174 registered high-equity multi-asset funds, only a handful emerged in the black at the end of the year.
The average fund in this subcategory was down 3.7%, according to Profiledata. Star performers were the Gryphon Prudential Fund of Funds
(up 5.4%) and the Olympiad BCI Managed Fund of Funds (up 5.24%).
Cash and short-term bonds were the best-performing local asset classes, delivering northwards of 7%.
GLOBAL MARKET
The JSE was in good company on its downward slide. The Visual Capitalist website, which contains informative financial infographics, recently published a infographic titled “How every asset class, currency and sector performed in 2018”. It shows that most asset classes ended 2018 in the red, with the S&P 500 (which measures the 500 top American stocks) down 6.2%, emerging markets down 16.9%, and non-us developed market stocks down 14.5% (all in dollar terms which, it must be said, strengthened against world currencies by 4.6% in 2018).
SOURCE: INDEPENDENT ON SATURDAY | AFFLUENCE | Page 10
Contact us
Phone: +27 (0) 31 767 5700
Cell: +27 (0) 82 455 9575
Email: support@olympiad.co.za
99 Jan Smuts Ave, Winston Park,
Gillitts, KZN, 3610
MONDAY-FRIDAY
The value of the investment may increase / decrease and past performance is no indicator of future growth.