RETURNS FROM DIFFERENT ASSET CLASSES 1987-2012
R1000 invested over 26 years
Equity
Bonds
Cash
Best Asset Class Per Year
R49,226.00
R42,348.00
R21,506.00
R660,493.00
16.08% pa
15.39% pa
12.32% pa
28.36% pa
(Source: Auret, C & Vivian, R. 2014. “A Comparative analysis of returns of various financial asset classes in South Africa: a triumph of bonds?”)
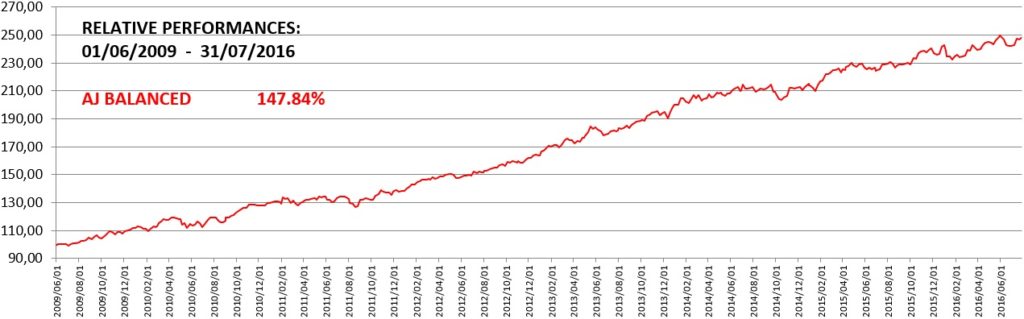
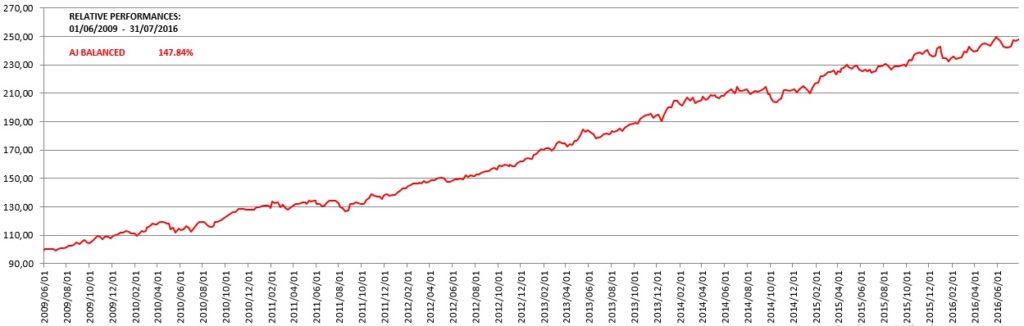
This Validates the Investment Strategy of the Olympiad Funds
Average annual investment returns per asset class 1960-2009
Average
%
Highest
%
Lowest
%
Equity
Bonds
Fixed Deposit
Inflation
19.4
10.5
9.8
8.6
91.3
39.8
18.0
18.4
-25.8
-17.7
4.0
0.3
If you could choose the best each year
27.3
Domestic managed*
17.1
*Split (75:20:5)
Source: Absa Investments
In a landmark paper, published in 1986, Determinants of Portfolio Performance, Brinson, Hood and Beebower concluded that asset allocation is the primary determinant of a portfolio’s performance and accounts for some 90% of the return experienced. Ibboston and Kaplan later confirmed this in 2000 with a finding of 75%.
Source: Financial Analyst Journal, 1986 and 2000